 akar.earth
Digital MRV (dMRV) for Nature-Based Carbon
dMRV for nature-based carbon explained: how field plots, remote sensing and data pipelines combine to produce verifiable tonnes for Indonesia.
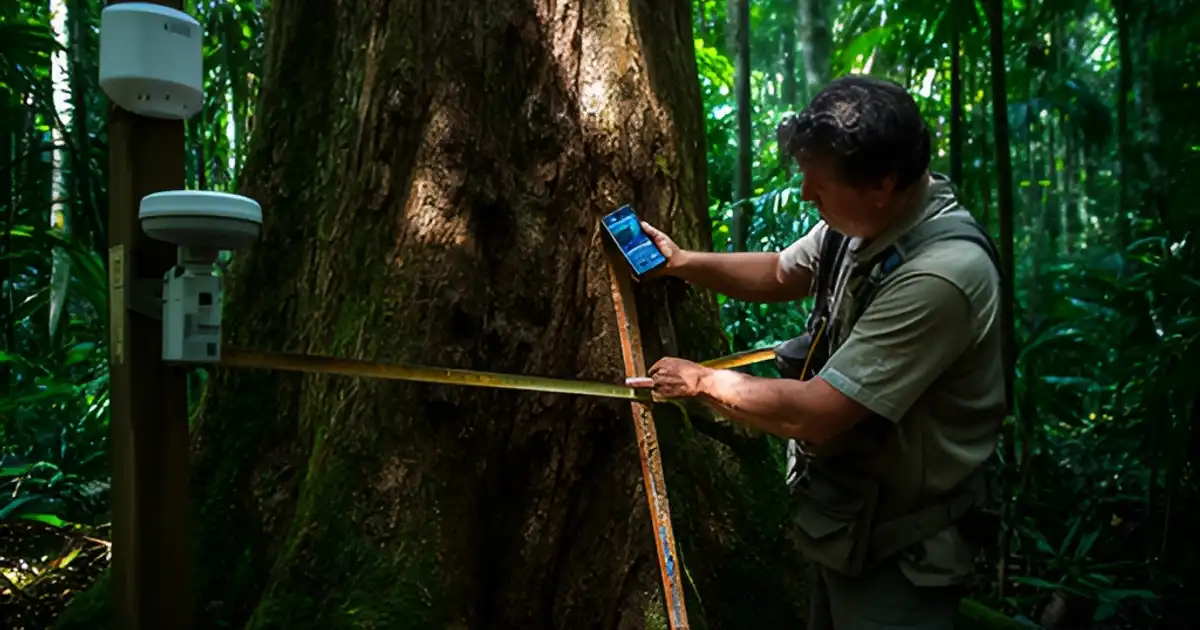
Digital MRV (dMRV) is the use of digital field tools, remote sensing and automated data pipelines to measure, report and verify the carbon a project claims. Done well, it produces a traceable chain from each tree measured in the field to each tonne issued on a registry, which is what verifiers and buyers now expect.
This hub explains the components of dMRV, why field-verified inputs still decide credit quality, and how to build a system that works in Indonesian conditions.
Why MRV became digital
Traditional MRV used paper forms, manual data entry and spreadsheets, with verification every few years. That made errors hard to trace and monitoring expensive. Three changes pushed the market to digital:
- Methodologies now expect remote sensing. Verra’s VM0047 v1.1 area-based approach uses remote sensing with a dynamic performance benchmark from control plots, plus plot sampling.
- Integrity scrutiny rose. After the REDD+ baseline debate, buyers and raters want to see the evidence, not only the result. The ICVCM CCP label requires an approved methodology under an eligible program.
- Supply chains need geodata. The EUDR requires plot geolocation and deforestation-free proof for coffee, cocoa, rubber, palm oil and wood.
A mental model: four layers
| Layer | What it does | Typical tools |
|---|---|---|
| Field | Measures trees, soil and boundaries on the ground | Mobile apps, DBH tapes, hypsometers, RTK GNSS, soil cores |
| Remote | Maps extent and change across the whole area | Sentinel-2, Landsat, PlanetScope, radar, lidar, drones |
| Model | Converts measurements to carbon and scales plots to area | Allometric equations, biomass models, uncertainty statistics |
| Ledger | Stores, versions and reports the evidence | Databases, QA rules, monitoring reports, registry submissions |
Each layer depends on the one below it. A biomass map is only as good as the field plots used to calibrate it. A monitoring report is only as good as the data lineage behind it.
Ground truth still decides quality
Satellite monitoring is now widely available, and many vendors offer it. What is hard to copy is good field data: plots placed by a sound sampling design, trees measured consistently, and boundaries mapped to survey-grade accuracy. Ground truth vs satellite explains why, and field plots vs remote sensing compares the two directly.
Key field topics:
- Designing forest inventory plots: stratification, plot size, number of plots and target precision.
- Measuring trees with mobile apps: DBH, height and photo evidence on smartphones.
- RTK GNSS for plot and boundary mapping: centimetre-level positions that hold up when plots are revisited.
- Choosing allometric equations for tropical trees, including pantropical models and when local equations are better.
Remote sensing
Optical imagery tracks canopy cover and change. Radar sees through cloud, which matters in much of Indonesia for most of the year. Spaceborne lidar such as GEDI samples forest height and structure. Drones map individual crowns at small sites.
- Using Sentinel-2 for forest monitoring and Sentinel-2 vs PlanetScope.
- Estimating above-ground biomass from remote sensing.
- GEDI spaceborne lidar and canopy height models.
- Drone photogrammetry for tree counting and crown mapping.
- Deforestation alert systems such as GLAD and RADD.
From data to tonnes
Carbon numbers are estimates with error. Methodologies require projects to quantify uncertainty and, if it is too high, deduct credits. Uncertainty and confidence deductions explains how sampling design directly affects revenue. AI in carbon MRV covers where machine learning helps (crown detection, biomass mapping, QA) and where it fails (extrapolating beyond training data, opaque models a verifier cannot audit).
Building a dMRV data pipeline from field to registry ties the layers together: data capture, QA, versioning, calculation, reporting and audit trail.
Indonesian conditions
Indonesia adds specific challenges. Cloud cover limits optical imagery. Smallholder plots are small and irregular, so boundary accuracy matters. Field teams work across remote islands with limited connectivity, so apps must work offline. Projects may need to report into both an international standard and the domestic SRUK registry, so data exports should not be locked to one format.
One dataset, several uses
The plot polygons, tree inventories and imagery that support a carbon monitoring report can also support EUDR geolocation and deforestation-free evidence for the same farms. Designing for both from the start avoids paying twice. See the EUDR hub and one field dataset for carbon and EUDR.
What verifiers check
Verifiers sample the evidence behind the monitoring report. They revisit a share of plots and remeasure trees, compare boundaries against imagery, check that equations match the methodology and the registered project description, and recalculate totals from the raw data. A dMRV system makes this faster when every number has a source, a timestamp, a location and a version. It makes it slower when data sits in personal spreadsheets or when calculations cannot be reproduced.
Common mistakes
- Buying a satellite product without calibration plots. A biomass map without local ground truth will not hold up at verification.
- Collecting data without a sampling design. Plots placed for convenience, such as near roads, bias results and raise uncertainty.
- Low-accuracy GPS. Phone GPS errors can exceed the size of a smallholder plot. Use RTK GNSS where boundaries matter.
- No version control. If equations, boundaries or datasets change between monitoring periods without records, verifiers cannot reproduce the numbers.
- Treating AI outputs as measurements. Model predictions need validation statistics and documented training data before they feed a monitoring report.
Working with us
We run RTK-surveyed plot campaigns, drone mapping and mobile tree measurement, and build monitoring pipelines that verifiers can follow. See dMRV implementation and monitoring and the AKAR dMRV tool. Every dMRV page is listed below.
Frequently asked questions
What is dMRV?
dMRV, or digital measurement, reporting and verification, uses digital field tools, remote sensing and automated data pipelines to quantify carbon and other outcomes and make the evidence auditable. It replaces paper forms and spreadsheets with traceable data from field to registry.
Can satellites replace field plots?
Not for carbon accounting. Satellites map change over large areas, but biomass estimates need calibration and validation against field-measured trees. Methodologies such as VM0047 still require plot sampling alongside remote sensing.
What does a verifier look for in dMRV data?
A clear chain from raw measurements to the reported tonnes: who measured what, where and when, which equations were applied, how uncertainty was calculated, and that the same inputs reproduce the same result.
Does dMRV help with EUDR?
Yes. Plot polygons, geolocation, imagery time series and deforestation checks used for carbon monitoring are the same evidence types the EUDR needs for deforestation-free claims.
AKAR tools
- The AKAR Tool Suite
AKAR carbon software for forest and land projects: eligibility screening, carbon simulation, dMRV, dashboards and drone mapping in one connected suite.
- AKAR dMRV: Field-to-Registry Monitoring
AKAR dMRV captures per-plot and per-tree field data with GPS, photos and timestamps, and turns it into traceable monitoring results for verification.
- AKAR Mapper: Drone and Boundary Mapping
AKAR Mapper turns drone flights and RTK surveys into orthomosaics, canopy height models and auditable boundary layers for carbon and EUDR work.
Comparisons
- Field Plots vs Remote Sensing for Carbon Stock
Field plots vs remote sensing for carbon stock estimation: accuracy, coverage, what methodologies require and how Indonesian projects combine both in practice.
- Lidar vs Photogrammetry for Forest Structure
Lidar vs photogrammetry for forest structure in Indonesia: canopy height, terrain under canopy, accuracy and when drones or lidar suit carbon projects.
- Sentinel-2 vs PlanetScope for Monitoring
Sentinel-2 vs PlanetScope for forest and EUDR monitoring in Indonesia: resolution, revisit, cloud, cost model, licensing and which to use for carbon projects.
Glossary
- Confidence interval: Definition
What is a confidence interval in carbon accounting? How 90% and 95% intervals express uncertainty in carbon stock estimates and trigger deductions for projects.
- Control plot: Definition
What is a control plot in carbon MRV? How control plots are chosen and monitored to measure baselines under VM0047 ARR, with tips for Indonesia.
- dMRV: Definition
What is dMRV (digital measurement, reporting and verification)? How apps, satellites and data pipelines speed up carbon project monitoring.
- GEDI: Definition
What is GEDI? NASA's spaceborne lidar on the International Space Station that measures forest canopy height and supports tropical biomass mapping.
- Ground truth: Definition
What is ground truth in remote sensing and carbon MRV? Why field data is used to train and check satellite models, and how to collect it well.
- Landsat: Definition
What is Landsat? The longest-running Earth observation satellite programme, and how its archive supports forest baselines and land history checks in Indonesia.
- Lidar: Definition
What is lidar in forestry? How laser scanning measures canopy height and forest structure for biomass and carbon estimates, with Indonesia examples.
- MRV: Definition
What is MRV (measurement, reporting and verification)? How carbon projects prove emission reductions and removals, with an Indonesia focus.
- NDVI: Definition
What is NDVI (Normalized Difference Vegetation Index)? How it is calculated, what it shows about vegetation, and its limits in tropical forest carbon work.
- Remote sensing: Definition
What is remote sensing in forest carbon? How satellites, aircraft and drones measure forest cover and biomass, and where field data is still needed.
- RTK GNSS: Definition
What is RTK GNSS? How real-time kinematic positioning gives centimetre-level accuracy for plot mapping, EUDR polygons and carbon project boundaries.
- Sampling error: Definition
What is sampling error in carbon inventories? How plot sampling creates uncertainty, how it is calculated and reduced, and why it cuts credit volumes.
- SAR: Definition
What is SAR (synthetic aperture radar)? How radar satellites see through cloud to monitor tropical forests, peat and mangroves in Indonesia.
- Sentinel-2: Definition
What is Sentinel-2? The free Copernicus optical satellite mission used for forest monitoring, EUDR checks and carbon project baselines in Indonesia.
- Stratification: Definition
What is stratification in forest carbon inventory? How dividing a project into similar strata cuts sampling error and cost, with Indonesian tips.
- Uncertainty deduction: Definition
What is an uncertainty deduction? How carbon methodologies cut credited tonnes when measurement error is high, and how to keep the deduction small.
Guides
- AI in Carbon MRV: Where It Helps and Where It Fails
AI carbon MRV explained: where machine learning genuinely improves forest carbon measurement, where it fails, and how verifiers judge AI-based estimates.
- Choosing Allometric Equations for Tropical Trees
Allometric equation guide for tropical trees: pantropical vs local models, wood density, height, palms, bamboo and mangroves, and how to justify your choice.
- Canopy Height Models: Global Products and Local Calibration
Canopy height model guide: how global 10 m and 30 m products are made, how drone and lidar CHMs differ, and how to calibrate them for Indonesian sites.
- Deforestation Alert Systems: GLAD, RADD and Integrated Alerts
Deforestation alerts GLAD RADD explained: sensors, resolution, latency, confidence levels and how to use integrated alerts for REDD+ and EUDR monitoring.
- Building a dMRV Data Pipeline from Field to Registry
dMRV data pipeline guide: how to move field, satellite and model data into monitoring reports and registries with versioning, QA/QC and an audit trail.
- Drone Photogrammetry for Tree Counting and Crown Mapping
Drone tree counting with photogrammetry: flight settings, ground control, crown detection and its limits for ARR, agroforestry and mangroves in Indonesia.
- GEDI Spaceborne Lidar for Forest Carbon
GEDI lidar biomass explained: how ~25 m footprints measure canopy structure, which data products to use, and its limits for carbon projects in Indonesia.
- Ground Truth vs Satellite: Why Field Plots Still Matter
Ground truth vs satellite carbon data: what satellites can and cannot prove, why field plots still anchor credits, and how to combine both efficiently.
- Measuring Trees with Mobile Apps: DBH, Height and Photos
Tree measurement app guide: how phones capture DBH, height, species and geotagged photos, how accurate they are, and what verifiers need to trust the data.
- Designing Forest Inventory Plots for Carbon Projects
Forest inventory plot design for carbon: plot size and shape, stratification, sample size for target precision, and permanent plots that pass verification.
- Estimating Above-Ground Biomass from Remote Sensing
Remote sensing biomass estimation explained: which sensors work, why field plots are needed, how saturation and error behave in Indonesian forests.
- RTK GNSS for Plot and Boundary Mapping
RTK GPS for forestry: how RTK GNSS gets centimetre positions, when you need it for plots and boundaries, and how to work under canopy in Indonesia.
- Using Sentinel-2 for Forest Monitoring
Sentinel-2 forest monitoring in practice: bands, 10 m resolution, cloud handling in Indonesia, change detection and what verifiers expect to see.
- Uncertainty and Confidence Deductions in Carbon Accounting
Uncertainty deduction carbon credits guide: how confidence intervals are calculated, when deductions apply, and how to reduce them with better design.
Services
- dMRV Implementation and Monitoring
dMRV implementation and monitoring for forest, agroforestry and mangrove carbon projects: field apps, satellite layers and audit-ready data pipelines.
- Field Data Campaigns: Plots, RTK and Drones
Field data campaigns in Indonesia: forest inventory plots, RTK-surveyed boundaries and drone mapping that calibrate carbon models and satellite products.